Infographics are one of the most popular forms of content on the web. They’re also one of the most effective ways to communicate complex information in a way that is both visually appealing and easy to understand.
When done right, infographics can be an incredibly powerful marketing tool. They can help you to attract new readers and followers, boost engagement, and even drive conversions and sales.
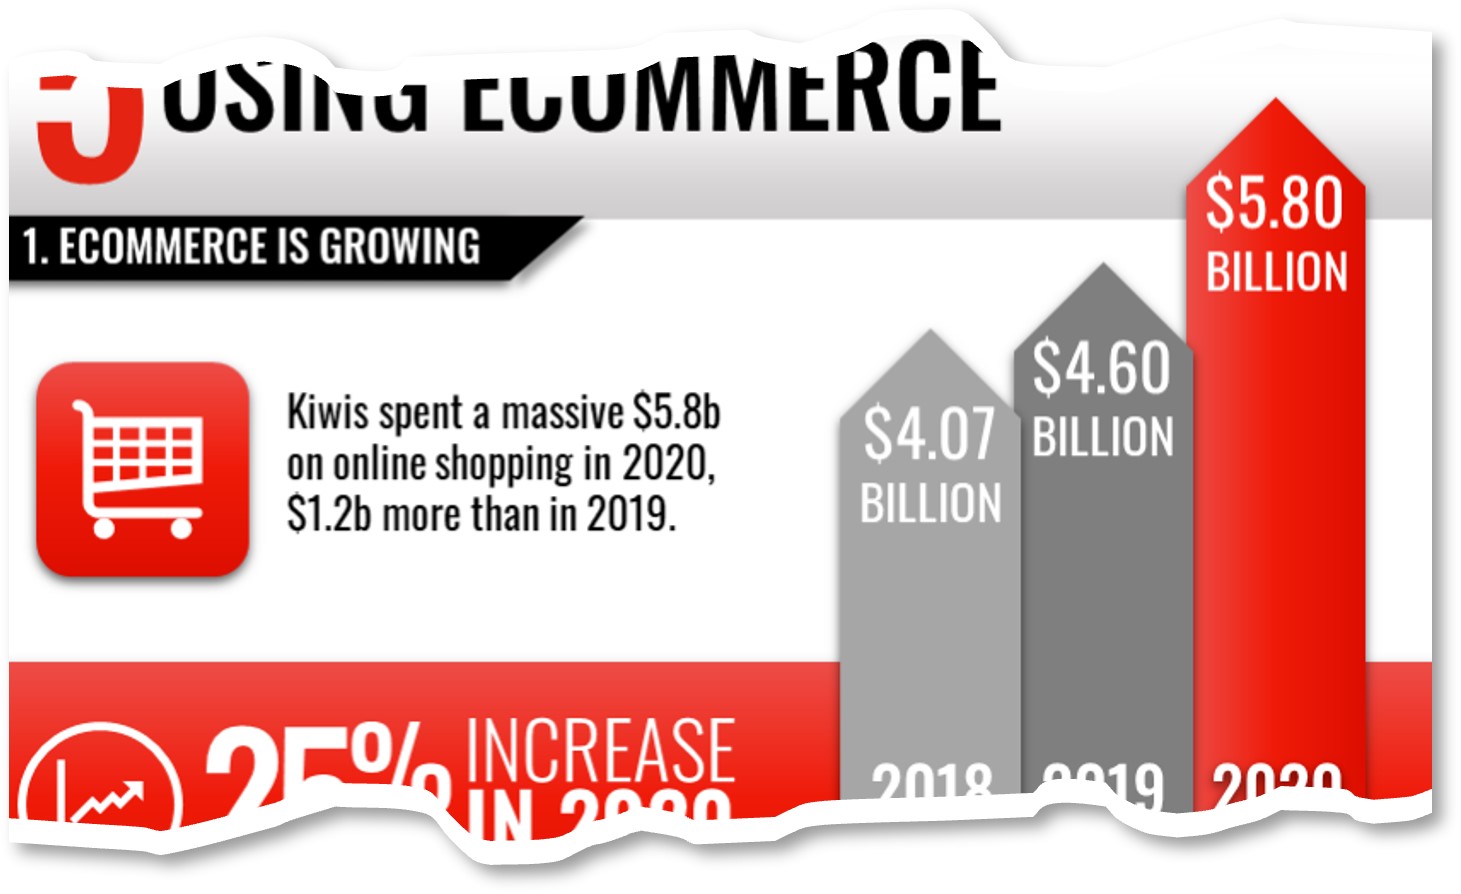
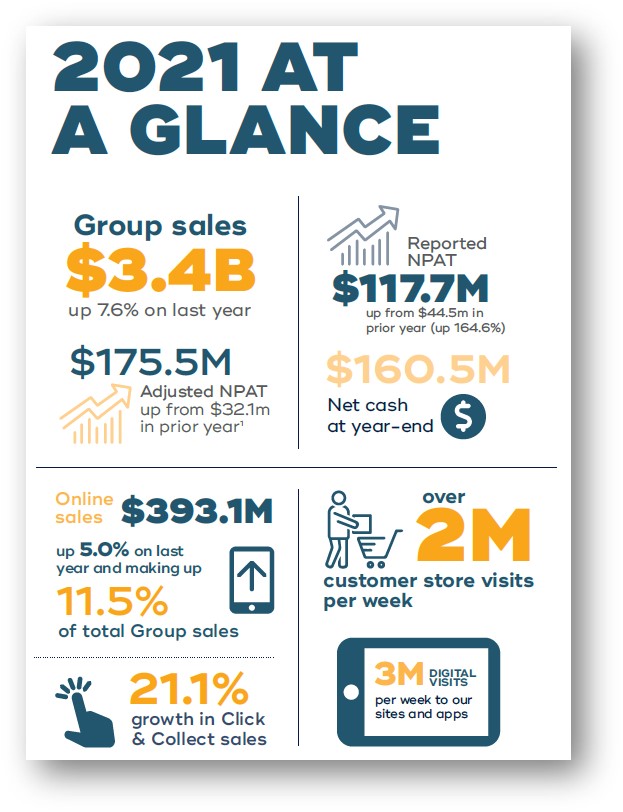
An infographic might be the most effective way for a chartered accountant to present end of year financials to a client’s board. It could present sales data more clearly than text alone. Chartered accountants often have an advantage here if they are using leading cloud-based accounting services like Xero. Xero present a lot of financial information in graphical formats that are essentially the same as infographics. If you are not already using a cloud-based accounting system, you can find out more about Xero here.
In fact, it might even be useful for presenting relevant information to aid making a sale.
However, creating an effective infographic is not always easy. There’s a lot that goes into designing and crafting a piece that will actually get results.
In this article, we’ll share with you everything you need to know about how to create an infographic that gets results.
Here’s what we’ll cover:
- Why infographics are so effective
- What makes a good infographic
- The elements of a successful infographic
- How to come up with infographic ideas
- The process of designing an infographic
- Promoting your infographic for maximum reach
Let’s get started!
Why Infographics Are So Effective
Infographics are effective for a number of reasons.
First, they’re visually appealing. People are naturally drawn to images and graphics, so an infographic is more likely to catch someone’s eye than a text-based article.
Second, they’re concise. An infographic can communicate a lot of information in a small amount of space. This makes them ideal for social media, where space is limited.
Third, they’re easy to share. People are more likely to share an infographic than they are to share a text article. This means that your infographic has the potential to reach a much larger audience than other types of content.
Fourth, they’re easy to understand. When done right, infographics can make complex concepts and data easy to understand. This makes them a great tool for explaining new products or services, or for breaking down the results of research or surveys.
Finally, they’re versatile. Infographics can be used for a variety of purposes, from driving traffic to a website to increasing brand awareness.
What Makes a Good Infographic?
Not all infographics are created equal. In order for an infographic to be effective, it needs to meet certain criteria. A good infographic is:
Visually appealing: An effective infographic uses images, graphics, and colors to capture attention and hold interest.
Concise: A good infographic conveys a lot of information in a small amount of space. It is easy to scan and digest.
Easy to understand: A good infographic uses simple language and straightforward design to make complex concepts easy to understand.
Shareable: A good infographic is designed to be shared. It includes social media sharing buttons and is optimized for search engines.
On-brand: A good infographic reflects the branding of the company or individual who created it. It uses the same colors, fonts, and style as the company’s other marketing materials.
Engaging: A good infographic tells a story that is interesting and engaging. It draws the reader in and keeps them hooked until the end.
The Elements of a Successful Infographic
Now that we’ve covered what makes a good infographic, let’s take a look at the elements that all successful infographics have in common. Every successful infographic includes:
A catchy headline: The headline is the most important part of an infographic. It should be attention-grabbing and make use of keyword rich phrases.
An eye-catching image: The image should be high-quality and relevant to the topic of the infographic.
Engaging copy: The copy should be well-written and easy to understand. It should flow well and be free of errors.
A clear call-to-action: The call-to-action should be clear and easy to spot. It should tell the reader what they should do next, such as visit your website or sign up for your email list.
Relevant data and statistics: The data and statistics should be relevant to the topic of the infographic and should come from a reliable source.
Good design: The infographic should be well-designed and easy to follow. The layout should be clear and the graphics should be high-quality.
Proper branding: The infographic should be properly branded with the company’s logo, colors, and fonts.
Before you Start
As with any design project, proper planning is essential to success. Here are a few tips on how to plan an infographic:
Define your goals: Before you start designing, it’s important to know what you want your infographic to achieve. Are you looking to raise awareness about a particular issue? Or perhaps you want to educate your audience about a certain topic. Once you know your goals, you can start to plan your content and design accordingly.
Design for your audience: Your infographic should be designed with your audience in mind. What’s in it for them? Consider what kind of information they will find most useful or interesting, and present it in a way that is visually appealing.
Research your topic: If you want your infographic to be informative and accurate, you need to do your research. Gather data from reliable sources and make sure you understand it before attempting to visualise it.
Choose the right format: There are many different types of infographics, so it’s important to choose the right format for your goals. If you want to convey a lot of data, a statistical infographic might be the best option. If you’re trying to tell a story, a narrative infographic might be more appropriate.
Keep it simple: Your infographic should be easy to understand at a glance. Use clear and concise language, and don’t try to cram too much information into one design.
How to Come Up With Infographic Ideas
The first step to creating a successful infographic is coming up with a great idea. There are a few ways to come up with infographic ideas:
Brainstorm: Sit down with a pen and paper and brainstorm a list of potential topics.
Repurpose existing content: Look through your existing blog posts and articles and see if there’s any content that could be repurposed into an infographic.
Check out competitor’s infographics: See what type of infographics your competitors are creating and try to come up with something similar.
Use Google Trends: Use Google Trends to see what people are searching for and try to create an infographic around a trending topic.
Use a keyword research tool: Use a keyword research tool like Google Keyword Planner or SEMrush to find popular keywords and create an infographic around one of those keywords.
Once you have a few ideas, it’s time to start narrow them down. Start by evaluating your ideas and asking yourself the following questions:
- Is the topic relevant to my audience?
- Is the topic something my audience would be interested in?
- Is the topic something my audience would be able to understand?
- Is the topic something my audience would be willing to share?
- Is the topic something I can create a unique angle on?
- Is the topic something I can create a catchy headline for?
If you can answer “yes” to all of these questions, then you probably have a good idea for an infographic. If not, it’s time to go back to the drawing board.
The Process of Designing an Infographic
Once you have a good idea for an infographic, it’s time to start designing it. There are a few different ways to approach designing an infographic. You can hire a professional designer, use a DIY infographic tool like Canva, or use a template.
Professional designer: If you decide to hire a professional designer, make sure to give them a clear idea of what you want the infographic to look like. Provide them with examples of other infographics you like and give them a list of requirements, such as the size, colors, and fonts you want to use.
DIY infographic tool: If you decide to use a DIY infographic tool like Canva, simply create an account and start creating your infographic. Canva offers a wide selection of templates, so you’re sure to find one that fits your needs.
Templates: If you decide to use a template, there are a few things to keep in mind.
- Make sure the template is easy to edit. You don’t want to spend hours trying to figure out how to change a small detail.
- Make sure the template is high-quality. A low-quality template will make your infographic look amateurish.
- Make sure the template is compatible with the software you’re using. Some templates only work with certain software programs, so it’s important to check this before you download anything.
Add the Copy
Once you have the design of your infographic finalized, it’s time to add the copy. When writing the copy for your infographic, keep the following tips in mind:
Make it scannable: People are more likely to skim an infographic than they are to read it word for word. So, make sure the copy is easy to scan by breaking it up into small paragraphs and using bullet points.
Keep it short and sweet: Don’t try to stuff too much information into your infographic. Keep the copy short and sweet and focus on the most important points.
Use simple language: Use language that is easy to understand. Avoid using jargon or technical terms.
Write a catchy headline: The headline is the most important part of the copy. It should be attention-grabbing and make use of keyword rich phrases.
Include a call-to-action: Make sure to include a call-to-action at the end of the infographic. Tell the reader what you want them to do, such as visit your website or sign up for your email list.
Proofread your work: Before you publish your infographic, be sure to proofread it for errors. This is especially important if you‘re including statistical data. Double–check your facts and figures to avoid any embarrassing mistakes.
Add the finishing touches
Once you have the copy finalized, it’s time to add the finishing touches.
Add your logo: Make sure to add your company’s logo to the infographic. This will help to brand the infographic and make it more recognizable.
Choose the right colors: The colors you use should be consistent with your brand’s colors. They should also be easy to read and not too overwhelming.
Use high-quality images: The images you use should be high-quality and relevant to the topic of the infographic.
Choose the right font: The font you use should be easy to read. It should also be consistent with the fonts you use in your other marketing materials.
Once you’re finished, save the infographic as a high-resolution JPEG or PNG file.
Promoting Your Infographic for Maximum Reach
Once your infographic is complete, it’s time to start promoting it. There are a few different ways to promote your infographic:
Share it on social media: Share your infographic on social media sites like Facebook, Twitter, and Instagram. Use relevant hashtags and tagging to help it reach a larger audience.
Embed it on your website: Embed your infographic on your website or blog. Be sure to include a description and a call-to-action.
Email it to your list: Email your infographic to your email list. Include a brief description and a link to where they can view it.
Submit it to directories: Submit your infographic to infographic directories and galleries.
Reach out to influencers: Reach out to influencers in your industry and ask them to share your infographic.
Paid promotion: Use paid promotion methods like Google AdWords or Facebook Ads to promote your infographic to a larger audience.
By promoting your infographic, you can help to ensure that it reaches the widest possible audience.
Conclusion
Infographics are a powerful marketing tool that can help you to attract new readers, followers, and customers.
However, not all infographics are created equal. In order for an infographic to be effective, it needs to meet certain criteria.
A good infographic is visually appealing, concise, easy to understand, shareable, on-brand, and engaging.
It also includes a catchy headline, an eye-catching image, engaging copy, a clear call-to-action, and relevant data and statistics.
Creating an effective infographic is not always easy. However, by following the tips in this article, you can create an infographic that is both visually appealing and easy to understand.